When thinking about money, many people focus only on their current budget or a single financial plan. The problem is that life rarely unfolds exactly as expected. Job changes, market swings, inflation spikes, or health issues can quickly shift financial stability. That’s why scenario planning—testing your finances against multiple possible futures—is one of the most powerful tools for personal finance.
The good news? You don’t need expensive software or advanced analytics to do this. A simple spreadsheet can help you model your future, test assumptions, and prepare for uncertainty. This article lays out a step-by-step framework for using spreadsheets to stress-test your income and investment plans.
Why Scenario Planning Matters
Planning for the “most likely” case is helpful, but it can lead to overconfidence. Scenario planning helps by:
- Showing how your finances react to best-, worst-, and middle-case futures.
- Revealing weaknesses in your plan before real problems occur.
- Guiding smarter decisions by highlighting which factors matter most.
- Reducing emotional stress by giving you a map for uncertainties.
Instead of just asking “Will I be okay?”, scenario planning helps answer “What happens if conditions change?”
Step 1: Define Key Variables
Start by identifying the variables that shape your financial future. These usually include:
- Income: Salary, freelance earnings, business income, side projects.
- Expenses: Fixed costs (rent, mortgage, utilities) and variable costs (food, travel, entertainment).
- Savings rate: How much you set aside each month or year.
- Investment growth: Assumptions about stock returns, bond yields, real estate growth, or other assets.
- Inflation: Rising costs of goods and services over time.
- Major life events: Buying a house, paying for education, health costs, retirement start age.
Listing these variables gives you the “levers” you can adjust in different scenarios.
Step 2: Build Your Base Case
Next, create the “most likely” future in your spreadsheet. This means entering assumptions that seem reasonable today. For example:
- Income rises by 2–3% per year.
- Expenses grow with inflation at 2%.
- Investments return 6% per year.
- Retirement starts at 65 with 25 years of expenses.
This base case is your starting point—the scenario you expect if nothing unusual happens. The spreadsheet should project results year-by-year so you can see balances grow or shrink over time.
Step 3: Create Best- and Worst-Case Scenarios
Now adjust variables to reflect other possibilities:
- Best-case: Higher income growth, stronger investment returns, or lower expenses. Example: income grows 5% per year, investments return 8%, and retirement costs are lower.
- Worst-case: Job loss, market downturn, or higher inflation. Example: no income growth for 3 years, investments return only 2%, inflation rises to 4%.
These scenarios will show how resilient your finances are and how much margin of safety you actually have.
Step 4: Add Stress-Testing
Beyond best- and worst-cases, stress-test extreme events. What if:
- You lose your job for a year?
- A market crash cuts investments by 30%?
- Unexpected medical costs arrive?
- Inflation doubles for 5 years?
By modeling these challenges, you can see whether your emergency fund, savings rate, or investment allocation can absorb shocks.
Step 5: Create Sensitivity Tables
One of the most powerful spreadsheet tools is a sensitivity or “what-if” table. Instead of just one fixed assumption for returns or inflation, you can view multiple possibilities at once. For example:
| Investment Return | Ending Balance at Retirement |
|---|---|
| 4% | $800,000 |
| 6% | $1,050,000 |
| 8% | $1,350,000 |
This table makes it easy to see how sensitive your plan is to small changes. If your future collapses with just a 2% difference in returns, you may need a safer strategy.
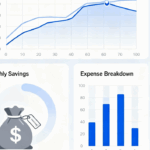
Step 6: Include Visual Dashboards
Numbers in spreadsheets can be intimidating. To make your scenarios easier to understand, add charts and graphs:
- A line chart showing your projected net worth over time in best-, base-, and worst-cases.
- A pie chart showing expenses by category.
- A bar chart showing how much annual savings changes across scenarios.
Visuals make the story clearer, especially if you want to explain your plan to a partner or advisor.
Step 7: Plan Responses in Advance
Scenario planning is useful only if it leads to action. For each scenario, write down a response:
- If income drops 20% → Cut discretionary expenses and pause investments.
- If returns are below 4% for 5 years → Increase savings rate by 5%.
- If costs rise faster than expected → Delay retirement by two years.
These pre-decided responses reduce panic and help you act confidently when challenges come.
Practical Example
Imagine Alex, age 35, earning $60,000 per year, saving $10,000 annually, and investing in a mixed portfolio.
- Base case: With 6% returns, they retire at 65 with $1.2 million.
- Best case: With 8% returns and higher income, they retire at 63 with $1.6 million.
- Worst case: With 3% returns and a job loss at age 45, they retire at 67 with only $750,000.
Because Alex sees the stress-test results, they decide to build a larger emergency fund and increase savings to $12,000 per year. This decision strengthens both short-term resilience and long-term independence.
Benefits of Spreadsheet Scenario Planning
- Low cost: No paid software needed—Excel or Google Sheets is enough.
- Flexibility: Fully customizable for personal circumstances.
- Clarity: Helps see the impact of changing assumptions clearly.
- Control: Replaces stress with actionable plans.
- Adaptability: Can be updated anytime as life evolves.
In short, your spreadsheet turns into a personal financial “flight simulator,” letting you practice before facing real turbulence.
Common Mistakes to Avoid
- Unrealistic assumptions (e.g., 12% annual returns).
- Ignoring inflation or underestimating expenses.
- Not updating the model regularly.
- Forgetting about liquidity—cash availability matters as much as long-term growth.
- Overcomplicating the spreadsheet—simplicity makes it usable.
Avoiding these mistakes keeps your scenario planning reliable.
The future is uncertain, but uncertainty does not have to mean fear. With a simple spreadsheet, you can map possible outcomes, prepare for shocks, and see exactly how your financial independence path could unfold.
Scenario planning is not about predicting the future—it’s about preparing for it. By defining assumptions, running best- and worst-cases, stress-testing surprises, and planning responses, you move from passive hope to active control.
Your financial future is too important to leave to chance. Build your spreadsheet, model your scenarios, and step confidently into whatever comes next.