Managing personal finances can feel overwhelming. Between income, expenses, investments, and debt, it’s easy to get lost in the details. Many people rely on budgeting apps or spreadsheets, but these often fall into one of two traps: they’re either too simplistic to provide insights, or too complicated to maintain.
That’s where a financial dashboard comes in—a streamlined, visual tool that gives you a clear overview of your financial health, like a cockpit for your money. Done right, it doesn’t just track data; it helps you make better decisions. Think of it as building your own Personal CFO system—a way to manage your finances with the clarity and precision of a business.
In this article, we’ll explore how to design a financial dashboard that actually works: one that is simple, actionable, and sustainable.
Why You Need a Personal CFO System
Businesses hire CFOs to oversee financial strategy, monitor performance, and ensure long-term stability. But individuals rarely apply the same rigor to their own money. Instead, we track expenses haphazardly or react to financial stress only when it’s urgent.
A personal CFO system bridges that gap. It:
- Centralizes information: income, spending, investments, and goals in one place.
- Visualizes performance: charts and metrics that reveal patterns instantly.
- Supports decisions: helps answer key questions like “Can I afford this investment?” or “Am I on track to retire?”
- Provides accountability: makes progress (or lack of it) visible, so you can’t ignore reality.
Without it, you’re essentially running your financial life blind.
Principles of a Dashboard That Works
Before we dive into building, let’s clarify what makes a dashboard useful.
- Simplicity over complexity – Too much detail creates noise. Your dashboard should answer a few core questions quickly.
- Actionable insights – Data should lead to action. If you see spending spikes, you should know what to do next.
- Consistency – It must be easy to update. A dashboard you can’t maintain is useless.
- Visual clarity – Humans process visuals faster than numbers. Graphs, progress bars, and color coding matter.
Think of your dashboard as a financial GPS: clear, focused, and reliable.
Step 1: Define Your Key Metrics
The first mistake people make is tracking everything. Instead, focus on a handful of metrics that give a snapshot of financial health. Examples include:
- Net Worth – Assets minus liabilities; your ultimate progress score.
- Cash Flow – Income vs. expenses each month.
- Savings Rate – Percentage of income saved/invested.
- Debt-to-Income Ratio – How much debt you carry relative to earnings.
- Investment Growth – Performance of your portfolio over time.
- Emergency Fund Status – Progress toward a 3–6 month buffer.
Choose 4–6 metrics that align with your goals. If you’re focused on debt payoff, prioritize debt metrics. If you’re investing, highlight portfolio growth.
Step 2: Choose Your Tools
You don’t need expensive software to build a dashboard. Options include:
- Spreadsheets (Google Sheets, Excel) – Customizable, flexible, free. Perfect for DIY dashboards.
- Personal Finance Apps (Tiller, YNAB, Mint alternatives) – Automate data import but may limit customization.
- No-Code Platforms (Airtable, Notion) – Combine flexibility with visualization features.
For most people, a spreadsheet is enough. It’s the simplest way to create something tailored and adaptable.
Step 3: Build the Layout
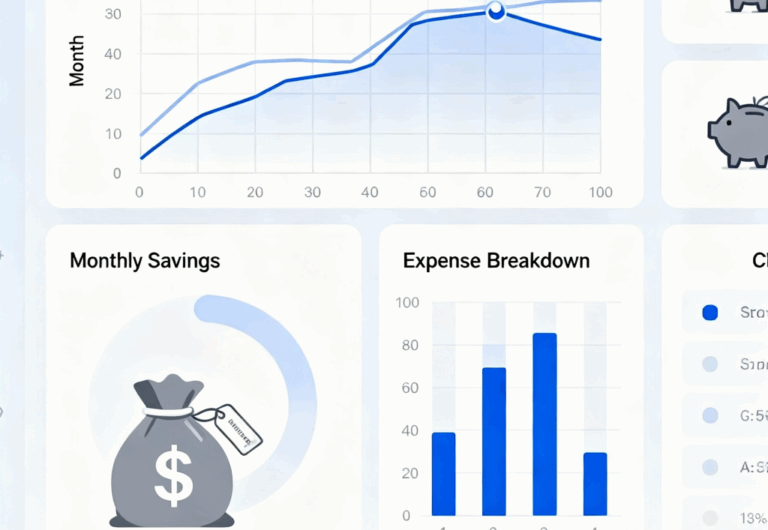
A strong dashboard organizes data into sections. Here’s a sample layout:
- Header Section – Big picture at a glance: net worth, cash flow, savings rate.
- Cash Flow Tracker – Monthly income vs. spending chart, with categories.
- Savings & Investments – Progress bars for emergency fund, retirement, or other goals.
- Debt Snapshot – Current balances, payoff timeline, interest saved.
- Trends & Forecasts – Graphs showing net worth and income growth over time.
Each section should be visual—bar charts, line graphs, progress circles. Numbers alone don’t motivate; visuals make progress tangible.
Step 4: Automate Where Possible
Manually entering data every week is a recipe for dashboard fatigue. Use automation to reduce friction:
- Connect bank feeds with Google Sheets via add-ons (e.g., Tiller).
- Import investment data through APIs or CSV uploads.
- Use formulas to auto-update progress bars or charts.
The less time you spend inputting, the more time you’ll spend using the dashboard for decisions.
Step 5: Create Review Rituals
A dashboard is only as valuable as your habit of reviewing it. Treat it like a CFO meeting.
- Weekly Review (10 minutes): Update balances, check cash flow, flag overspending.
- Monthly Review (30 minutes): Evaluate trends, adjust goals, celebrate wins.
- Quarterly Review (1 hour): Revisit big-picture goals: Are you on track for savings, debt, or investment targets?
These rituals transform the dashboard from static data into a living strategy.
Case Study: The Power of Visual Finance
Consider Alex, a freelancer juggling inconsistent income. Before building a dashboard, he often overspent in high-earning months and panicked during slow ones.
He created a dashboard showing:
- A rolling 12-month income vs. expenses chart.
- A cash flow forecast based on average expenses.
- A savings rate bar that turned green when above 20%.
Within six months, Alex stabilized his finances. By visualizing patterns, he adjusted spending in real time and built a steady emergency fund. The dashboard became his silent CFO—always keeping him accountable.
Common Mistakes to Avoid
- Too much detail: Don’t track every coffee. Focus on trends, not minutiae.
- Over-automation: Relying entirely on apps can create “black box” blindness. Know how your data works.
- Neglecting goals: A dashboard without goals is just decoration. Tie every chart to an outcome.
- Ignoring behavior: Numbers matter, but the point is to change habits. Make sure insights lead to action.
The Bigger Picture: Becoming Your Own CFO
When you run your finances like a business, you shift from reactive to proactive. You stop guessing and start managing.
Your personal CFO system isn’t about perfection—it’s about clarity. With a well-designed dashboard, you can:
- Spot leaks before they sink you.
- Track progress toward freedom milestones.
- Build confidence in your financial decisions.
And perhaps most importantly, you replace financial anxiety with financial awareness.
A Dashboard for Your Life
Money management doesn’t have to be chaotic. With the right dashboard, you gain a clear, visual, and actionable overview of your financial life—like piloting with instruments instead of flying blind.
So don’t wait for financial independence someday. Build your personal CFO system today. Start simple, stay consistent, and let your dashboard guide you toward smarter choices.
Because in the end, financial independence isn’t about numbers on a page—it’s about clarity, control, and confidence. And that starts with a dashboard that actually works.